VISUALIZING STATISTICAL DATA
“There is no such thing as information overload. There is only bad design.”
- Edward Tufte

Visualizing Statistical Data
For this project, I worked from five selected data tables from the many included in the United Nations Report on the Progress towards the Sustainable Development Goals (SDGs).
For designers, these goals are categories of “wicked problems,” which are large-scale issues that have innumerable facets and are comprised of multiple systems of influence upon them. One role for designers is to help multi-disciplinary teams make sense of the problems.
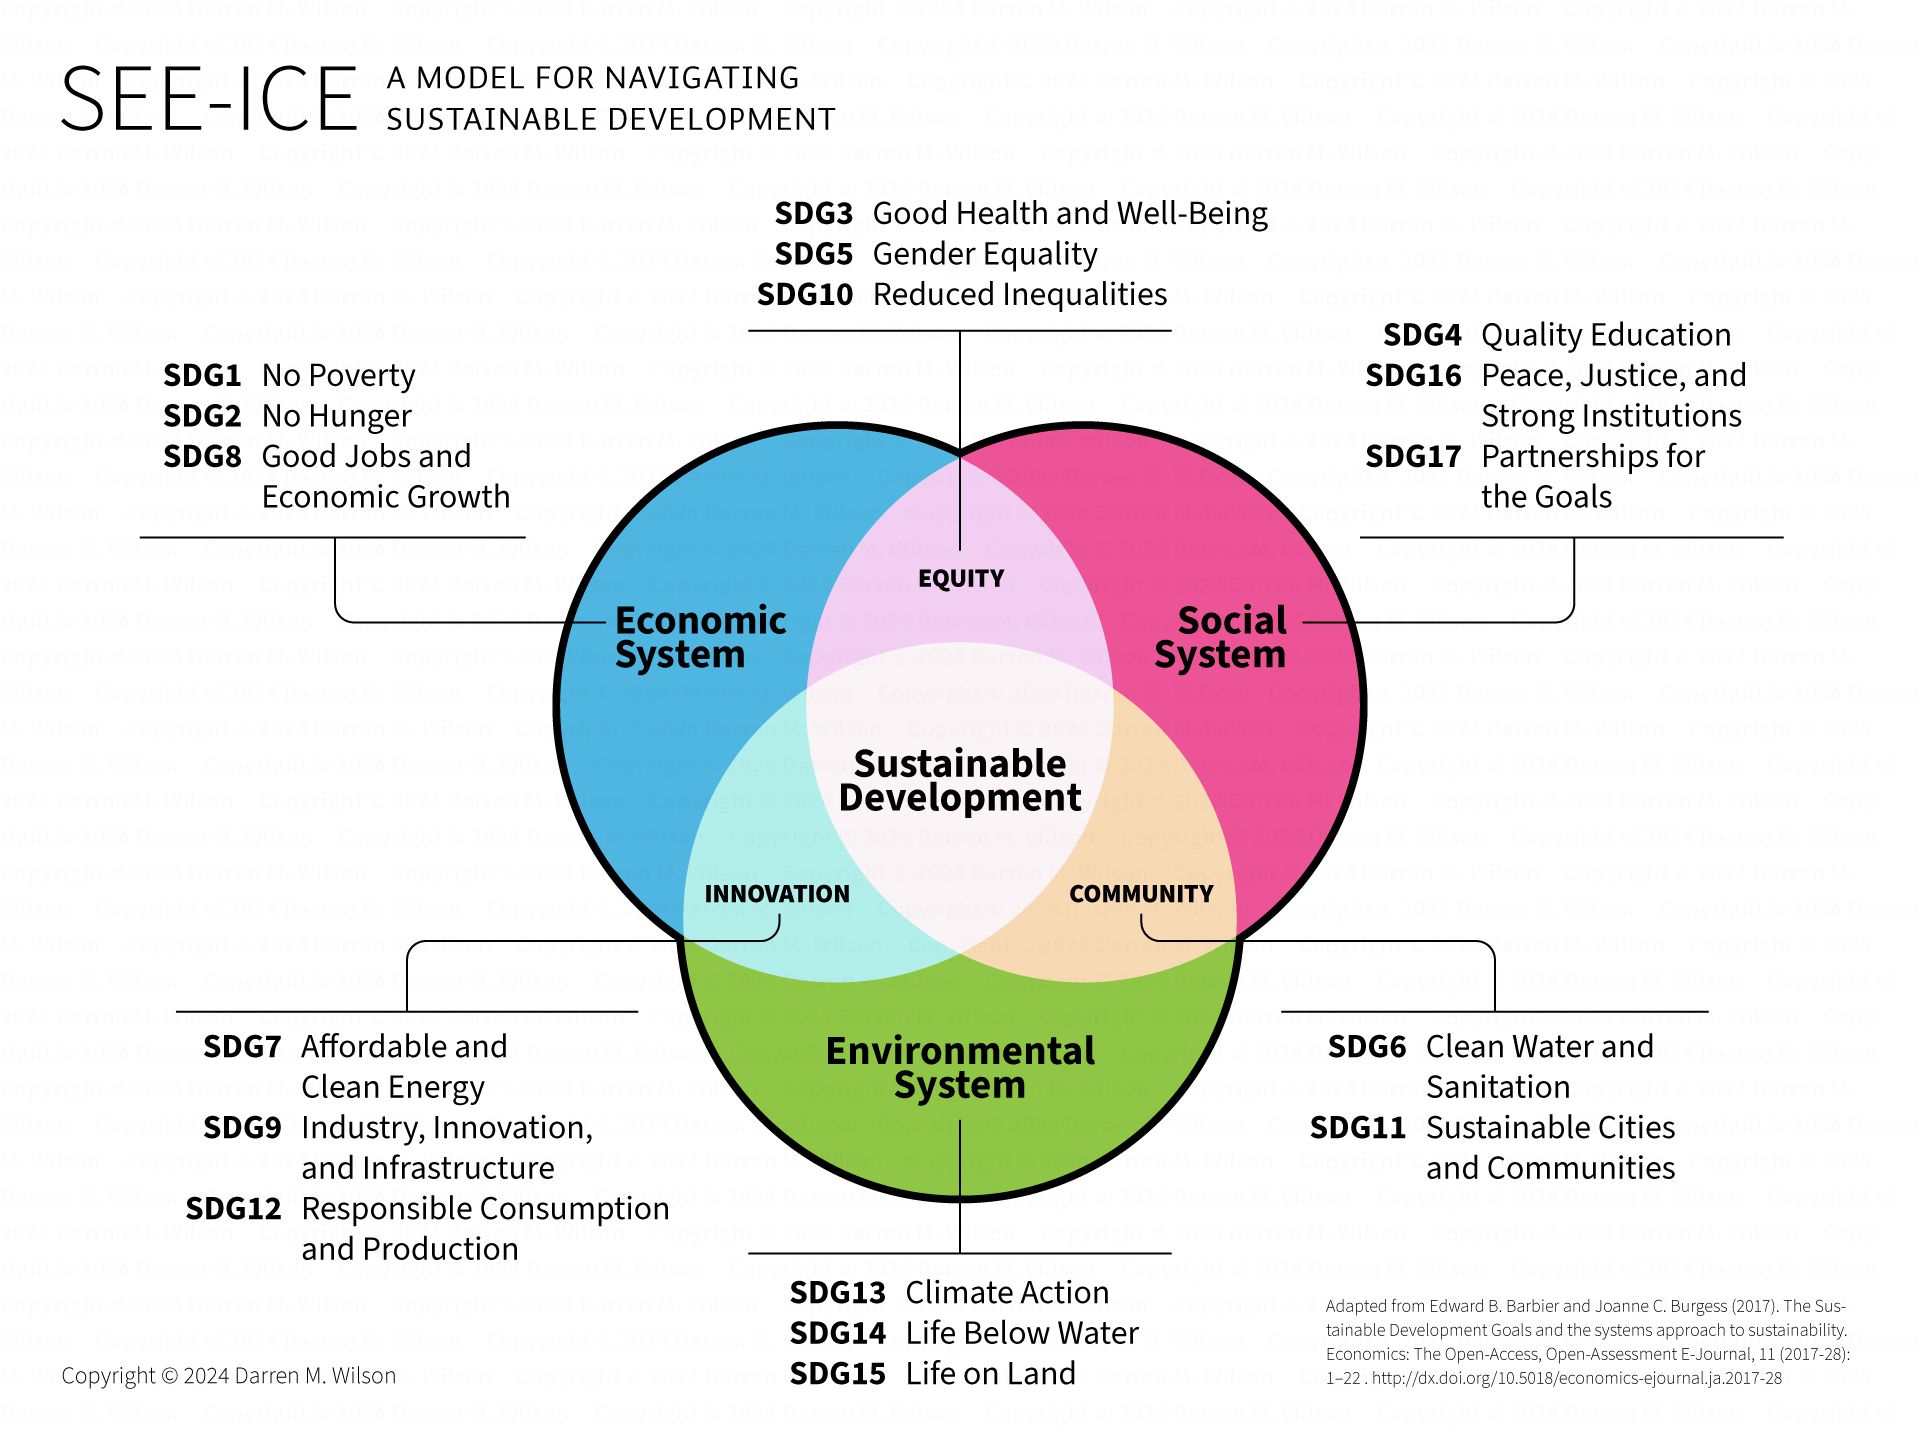
SDG Chart. Darren M. Wilson.
From these SDGs, the narrative I wanted to visualize was;
Children without legal identity (16.9.1) are often found in environments of low socioeconomic support (1.3) and primary education completion rates (4.1.2), where they are disproportionately engaged in child labour (8.7.1) (regionally), which follows with a low quality of health (HIV, 3.3.1.c).
The data across these five categories showed clear and consistent patterns in regards to certain regions and discrepancies from the world average.
Full Website Preview
The initial design I made for this website considered the idea of a place where studios and firms can upload and contribute organized graphs and stories to a collection.
In making this data more compelling and interesting, I added interaction within my design.
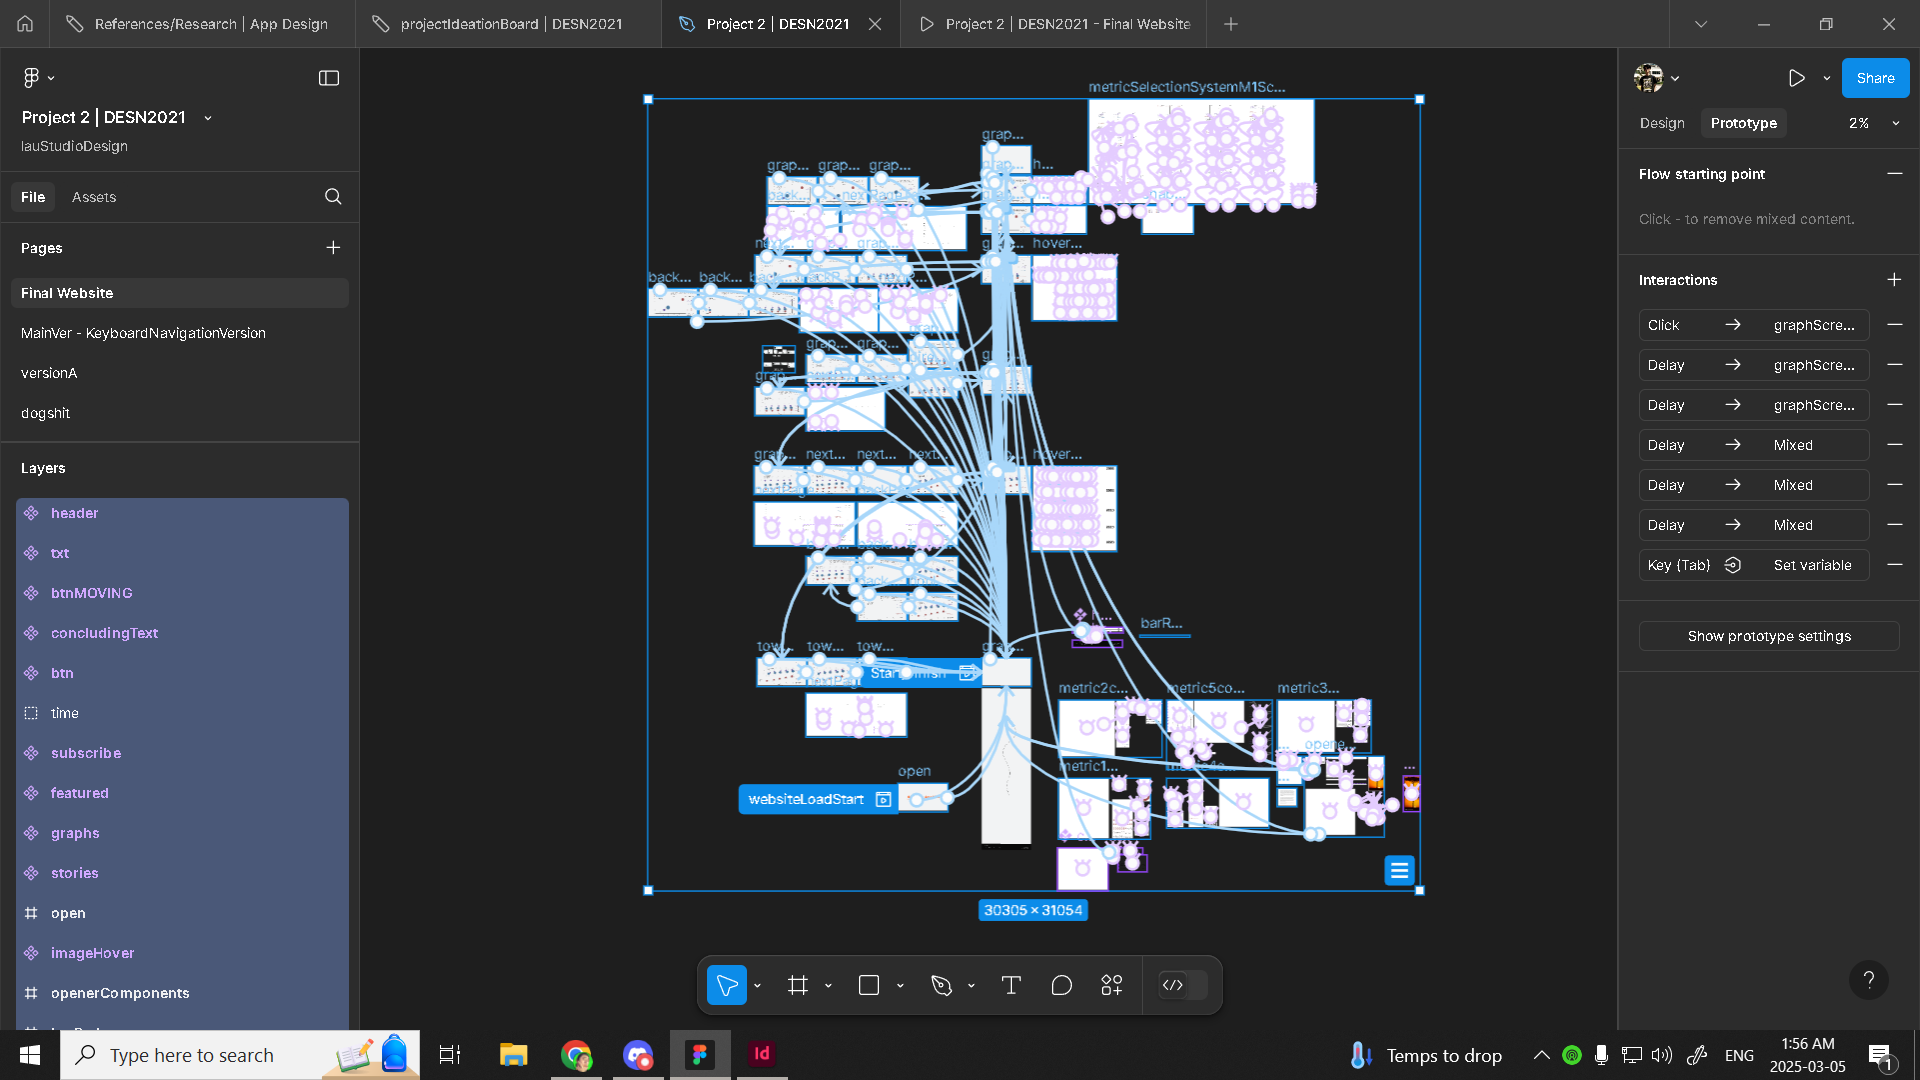
Full Website Figma File
This website contains well over 150 interactions. These interactions enhance the information the user is given and simplify unneccessary data points. Every data point is hoverable, providing it’s own unique pie graph, data year, name, and specific data values. The idea behind this is to allow for the defocus on regions aside from Sub-Saharan Africa, World Average, and Latin America & the Caribbean. By graying out all other data points, they merely provide context to how it affects the world average, which is what our focus regions are comparing themselves to. Additionally, circle size provides information about its relative impact (ex, Oceania is rather small, so it has less of an impact on average).
The idea of this website navigation is a step-by-step process, showing detailed data between the five metrics, as well as comparisons between two metrics. This side graph was one of the largest prototyping processes I’ve ever created; however, it is essential to deal with the challenge of comparisons without a streamlined timeline.

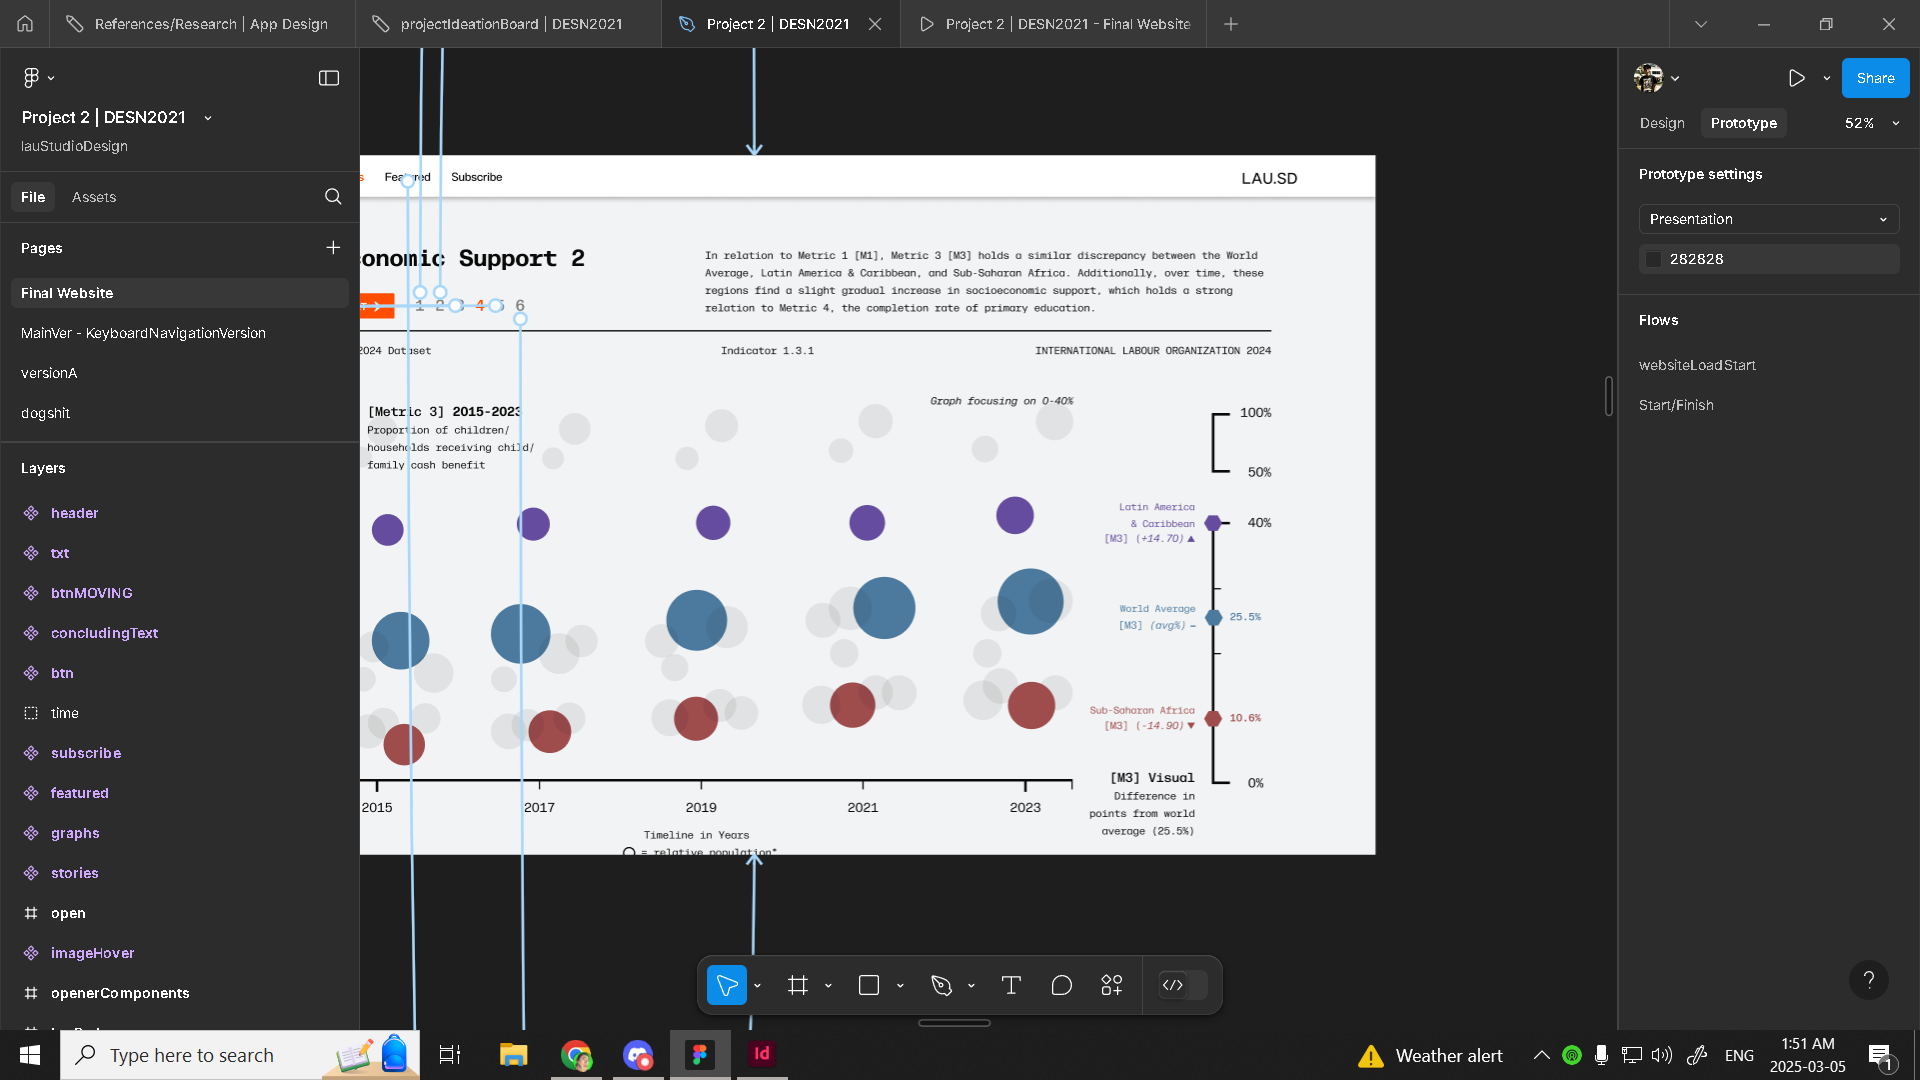
GRAPH RATIONALE:
The graphs I used for my detailed graph page included pie charts, bubble charts, and dot charts. I used consistent graphing tools to help the user comprehend the massive amounts of data these four metrics provide.
By hiding the specific data and removing hierarchy from data points aside from the three focal data points, the user can comprehend and associate regions by colour as there are not many regions to compare.
The graphs I used for my summary included pictograms, pie charts, fluid dot charts, bar graphs, and a parallel coordinate plot.
The main idea of this page is to show a general summary and not get too detailed within the full data. I used easy-to-understand graphs like pie charts and pictograms as the main elements on this page. I also used visuals related to the metric to provide more context.
In Metric 5, the parallel coordinate plot, I compared it with all other 4 metrics, showing a final conclusion/comparison of the data. Below that is a button to guide the user toward the more detailed graphs/metric comparison page.